





You are shopping for a new GPU. You Google best GPU 2025 and open five different websites. One ranks the RTX 4070 Super above the RX 7800 XT. Another does the opposite. A third lists a completely different GPU at the top.
Now you are more confused than when you started. This happens to every gamer who tries to use GPU performance charts without understanding what those charts actually measure. The charts are not wrong. They are just measuring different things at different times under different conditions.
This guide fixes that confusion permanently. You will understand exactly how GPU performance charts are built, why rankings shift between websites, and how to use that data to make a buying decision you will not regret.
What Is a GPU Performance Chart?
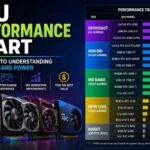
A GPU performance chart is a visual comparison of graphics card performance across a set of standardized tests. Those tests can be gaming benchmarks, synthetic workloads, creative rendering tasks, or power efficiency measurements. The chart takes those numbers and arranges graphics cards from highest to lowest so you can see where each one stands relative to the competition.
The key word there is “relative.” A performance chart does not tell you how a GPU feels in the game you play at your specific resolution on your specific monitor. It tells you how one card performed compared to another card under identical controlled conditions.
That is useful information. But it is only part of the picture, and most people try to use it as if it were the whole story.
GPU performance charts come in a few distinct types. Benchmark charts show synthetic scores from tools like 3DMark. FPS charts show average frame rates in specific games at specific settings. Ranking charts combine multiple data points into a tier-based hierarchy. Power efficiency charts show how much performance you get per watt of electricity consumed. Each type answers a different question, and mixing them up leads to bad buying decisions.
How GPU Performance Charts Are Made
Understanding how charts are built makes their results far easier to interpret.
Synthetic Benchmarks
Tools like 3DMark TimeSpy and 3DMark Port Royal run standardized graphics tests that are completely independent of any specific game. They stress the GPU with controlled rendering tasks and produce a numeric score.
The advantage is consistency. A synthetic score produced today will produce the same result on the same hardware six months from now. The disadvantage is that real games are far messier and more unpredictable than a controlled synthetic workload. A GPU that scores brilliantly in TimeSpy may underperform in a poorly optimized open world title because the game engine makes demands that the synthetic test never did.
Unigine Heaven and Superposition are other widely used synthetic benchmarks. Both push GPU rasterization performance hard and produce comparable scores across hardware generations.
Real Game Benchmarks
Real game testing involves running a repeatable in-game sequence, usually a built-in benchmark or a scripted fly-through, and recording average FPS, minimum FPS, and frame time consistency.
Games like Cyberpunk 2077, Red Dead Redemption 2, and Hogwarts Legacy are common benchmark titles because they are visually demanding, widely played, and include built-in benchmark sequences that remove human variation from repeated test runs.
Real game benchmarks are the most useful data for gamers. A result from Cyberpunk 2077 at 4K ultra settings tells you directly whether a GPU can handle that specific experience.
FPS-Based Testing
FPS benchmarking records not just average frame rate but also one percent low frame rates and frame time consistency. Average FPS tells you how fast the GPU is. One percent lows tell you how smooth it feels.
A GPU averaging 90 FPS with one percent lows of 75 FPS will feel smoother than a GPU averaging 100 FPS with one percent lows of 40 FPS. Charts that only show average FPS miss this crucial distinction.
Power Efficiency Testing
Performance per watt charts measure how much FPS or benchmark score a GPU delivers for each watt it consumes. This matters significantly for small form factor PC builders, laptop gamers, and anyone paying attention to electricity costs over the lifetime of the hardware.
NVIDIA’s Ada Lovelace architecture and AMD’s RDNA 3 both deliver meaningfully better performance per watt than the previous generation. Charts that ignore efficiency tell you which GPU is fastest but not which one is smartest.
Understanding GPU Ranking Charts
GPU ranking charts arrange cards from most powerful to least powerful based on combined benchmark data.
Higher rank does not always mean better for you personally. A card ranked third overall at 4K performance may be ranked eighth in the same chart at 1080p because high-resolution performance favors GPUs with wider memory buses and more VRAM, while 1080p performance favors raw shader throughput and clock speed.
Rankings also change between websites because no two reviewers test the same game list, the same driver versions, or the same test platform. One site testing with an Intel Core i9-14900K will produce different results than another site testing with a Ryzen 9 7950X, even on identical GPUs, because CPU performance influences GPU benchmark results in CPU-sensitive scenarios.
This is not a flaw. It reflects reality. Different systems produce different results. The most trustworthy charts clearly state the exact test platform, driver versions, and game list used.
GPU Performance by Resolution
Resolution is the single most important variable in GPU performance charts and the most commonly ignored one by buyers.
1080p Gaming Charts
At 1080p, the GPU workload is relatively light. Many modern GPUs can push well above 100 FPS in demanding titles, which means the CPU starts to influence benchmark results significantly. An RTX 4090 paired with an older CPU at 1080p in GTA V will score lower than expected because the CPU cannot prepare frames quickly enough.
Cards like the RTX 4060 and RX 7600 are built specifically to excel at 1080p. Their VRAM capacities and memory bandwidth are optimized for this resolution. Ranking charts that test at 1080p show these cards performing better relative to more expensive options than charts at higher resolutions do.
1440p Gaming Charts
1440p is the sweet spot for modern mid-range and high-end GPUs. The workload is heavy enough that GPU performance dominates over CPU performance in most games, making benchmark results cleaner and more representative of real-world experience.
Fortnite at 1440p competitive settings, Call of Duty Warzone at 1440p high, and Black Myth: Wukong at 1440p high are all common benchmark scenarios at this resolution. Cards in the RTX 4070 and RX 7800 XT range show their full capability here in ways they cannot at 1080p.
4K Gaming Charts
4K is where GPU rankings stabilize most reliably. The workload is so heavy that CPU influence is minimal and the GPU’s raw capabilities determine nearly all of the performance outcome.
Cyberpunk 2077 at 4K ultra, Hogwarts Legacy at 4K ultra, and Red Dead Redemption 2 at 4K ultra with maximum settings are the most GPU-demanding mainstream benchmark scenarios available. Only flagship cards like the RTX 4080 Super, RTX 4090, and RX 7900 XTX can maintain 60 FPS or above in all three without relying on DLSS or FSR upscaling.
GPU Performance Chart vs Real Gaming Performance
Charts are produced in controlled environments. Your gaming setup is not a controlled environment.
Game optimization varies wildly between studios. Cyberpunk 2077 after its 2.0 patch performs dramatically differently than it did at launch, even on identical hardware. Driver updates from NVIDIA and AMD regularly change benchmark scores by five to fifteen percent in specific titles.
A game that received poor GPU driver optimization at launch may rank a particular card poorly in charts published during that window. Six months later with updated drivers, the same card in the same game may perform significantly better, but older articles and charts will never reflect that change.
CPU bottlenecks are another major gap between chart results and real-world experience. Charts produced with a top-tier CPU show GPU-limited results that may not represent what happens when the same GPU is paired with a mid-range CPU in an actual gaming setup.
Always check the test platform specifications when reading any performance chart. The CPU used in testing matters almost as much as the GPU being tested.
GPU Tier List Explained
GPU tier lists group graphics cards into performance categories rather than strict numerical rankings. Entry-level GPUs like the RTX 4060 and RX 7600 target smooth 1080p gaming at high settings. They are not built to max out every modern AAA title. They are built to deliver consistent 60 to 100 FPS gameplay at a price most buyers can reach.
Mid-range GPUs like the RTX 4070 and RX 7800 XT are the most popular category for a reason. They handle 1440p gaming excellently in nearly every title and can push into 4K territory in less demanding games or with upscaling enabled. Most gaming setups are built around this tier.
High-end GPUs like the RTX 4070 Ti Super and RX 7900 XT handle demanding 4K gaming and serve content creators who need fast rendering alongside gaming performance. They cost significantly more than mid-range options and the performance jump per dollar narrows considerably.
Flagship GPUs like the RTX 4090 and RX 7900 XTX sit at the absolute top of the consumer stack. They dominate every benchmark and handle native 4K ultra settings in every available title. They cost more than most entire gaming PC builds and represent more performance than the majority of gaming use cases actually require.
Why GPU Charts Can Be Misleading
Several factors cause benchmark charts to misrepresent real-world performance for specific buyers. Driver updates change everything. NVIDIA regularly improves performance in specific titles through driver optimizations. A chart published before a major driver release may show a card performing worse than it actually does today.
Ray tracing performance splits cards dramatically. A chart that tests only rasterization performance may rank one card above another, but enabling ray tracing in Black Myth: Wukong or Cyberpunk 2077 can completely reverse that ranking. NVIDIA cards have historically held a large advantage in ray tracing workloads due to dedicated hardware acceleration.
VRAM limitations do not show up in average FPS results until a scene pushes past the card’s memory capacity. An 8GB GPU may benchmark identically to a 12GB GPU in a controlled test sequence but fall apart in later game levels or at higher texture settings where VRAM demand exceeds its capacity.
Thermal throttling is another silent chart distortion. A GPU that sustains high clock speeds for a five-minute benchmark run may throttle its clock speeds during a longer gaming session if cooling is insufficient. Short benchmark windows do not always catch this behavior.
Best Tools to Analyze GPU Performance
3DMark from Futuremark is the industry standard for synthetic GPU benchmarking. TimeSpy tests DirectX 12 rasterization performance. Port Royal tests ray tracing capability. Both scores are widely comparable across hardware review sites.
Unigine Heaven and Superposition are excellent for stability testing and sustained load benchmarking. They push the GPU hard over extended periods, which helps identify thermal throttling behavior that short synthetic tests miss.
The Blender Benchmark measures GPU rendering performance for 3D workloads. This is most relevant for content creators but also gives useful data on how efficiently a GPU handles compute tasks that differ from gaming rendering pipelines.
TechPowerUp’s GPU database is one of the most comprehensive free resources for comparing GPU specifications and benchmark scores across a huge range of hardware. It includes historical data that lets you track how performance has changed with driver updates over time.
How to Use GPU Performance Charts Before Buying
Start by defining your gaming resolution. If you play at 1080p, filter your chart research to 1080p benchmark results specifically. Comparing 4K charts to make a 1080p buying decision leads to overspending on hardware capabilities you will never use.
Set your FPS target before comparing numbers. A 60 FPS target requires far less GPU power than a 144 FPS target at the same resolution and settings. Know your monitor’s refresh rate and match your GPU purchase to that ceiling.
Look at real game benchmark results in titles you actually play. A GPU that scores brilliantly in Cyberpunk 2077 but poorly in Fortnite is the wrong buy if Fortnite is your primary game.
Check VRAM capacity relative to your resolution and texture setting preferences. An 8GB GPU may be perfectly adequate at 1080p and 1440p in most games but struggle at 4K in texture-heavy titles.
Factor in power consumption. A GPU that draws 300 watts continuously costs meaningfully more to run over a multi-year ownership period than one drawing 200 watts for similar performance output. Efficiency charts matter beyond the initial purchase price.
Common Mistakes When Reading GPU Charts
The biggest mistake is looking only at the ranking position without reading the resolution and settings used to generate that ranking. A card ranked fourth overall at 4K may be ranked ninth at 1080p. Both rankings are accurate. Neither is complete on its own.
Ignoring one percent low FPS data in favor of average FPS leads to buying a GPU that looks fast on paper but feels choppy during actual gameplay. Smooth gaming comes from consistent frame delivery, not just high averages.
Overvaluing synthetic benchmark scores from tools like 3DMark is extremely common. A high TimeSpy score does not guarantee strong performance in every game. Real game benchmarks in your specific target titles are always more valuable than a synthetic score.
Comparing charts from different driver versions without noticing the difference introduces noise that makes cards appear better or worse than they actually are relative to each other. Always check that charts being compared were produced under similar conditions.
Conclusion
GPU performance charts are some of the most useful tools in PC hardware research. They are also some of the most misused.
A chart is a snapshot of performance under specific conditions at a specific point in time. Drivers change, games get patched, and new optimization work shifts rankings regularly. The card ranked highest today may not be ranked highest in six months.
Use charts to narrow your options, not to make your final call. Find charts that test at your resolution with real game titles you recognize. Pay attention to power efficiency alongside raw performance. Read one percent low FPS data alongside averages.
When you understand what a chart is actually measuring and what it cannot tell you, you stop being confused by conflicting rankings and start seeing the complete picture those charts are trying to paint.
The best GPU for you is not the one ranked highest in every chart. It is the one that delivers the frame rates you want at the resolution you use in the games you play at a price and power level that fits your setup.
Frequently Asked Questions
What is a GPU performance chart?
A GPU performance chart is a visual comparison of graphics cards based on benchmark tests. It shows how different GPUs rank under the same conditions like resolution, game settings, and workload.
Are GPU benchmark charts accurate?
They are accurate for the specific test conditions used. However, results may not perfectly match your system because performance changes with different CPUs, drivers, games, and settings.
Why do GPU rankings change between websites?
Different websites use different test systems, games, drivers, and resolutions. These variations cause the same GPU to score differently across benchmarks.
Which GPU performance chart is most reliable?
Charts from reputable hardware reviewers like Tom’s Hardware, Digital Foundry, and AnandTech are most reliable because they clearly explain their testing methods and system setups.
How do I use GPU charts for buying a graphics card?
Use charts that match your target resolution and the games you play. Focus on real-world FPS performance, VRAM size, power usage, and 1% low FPS before making a final decision.